Dans un nouvelle vidéo, Ludwig Reinhard, consultant Dynamics 365FO/AX en Allemagne, montre comment améliorer Microsoft Project Operations avec une meilleure visualisation des risques. Pour ce faire, il utilise notre Matrice des risques Power BI visuel.
Dans la vidéo, Ludwig montre sept étapes qui sont nécessaires à l'intégration de la carte thermique des risques dans les opérations du projet. Tout d'abord, il ajoute de nouveaux champs à la table Dataverse Risk et crée une série de risques à évaluer. Il ouvre ensuite la solution PP et ajoute un nouvel élément de navigation.
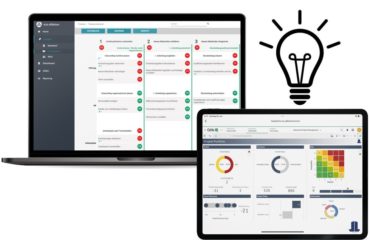
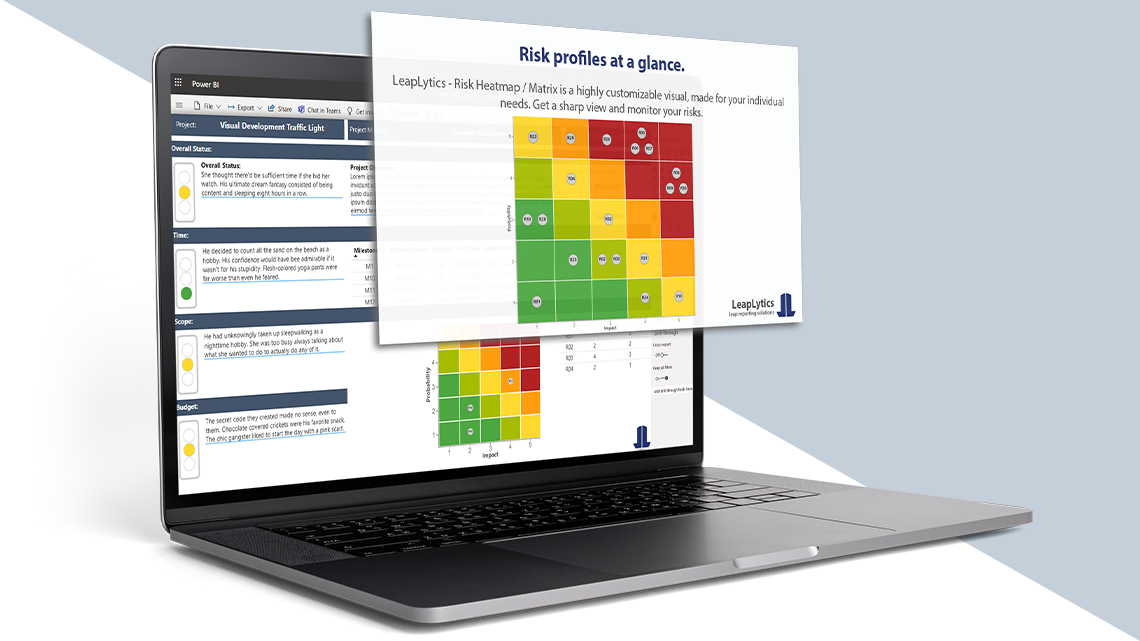
L'essentiel de la vidéo porte sur la manière de connecter les données et de concevoir la matrice des risques dans Power BI Desktop, puis de l'épingler au tableau de bord des opérations de projet. Le résultat est une carte de risque graphique qui permet aux utilisateurs des opérations de projet d'identifier et d'évaluer les risques immédiatement.
"Notre carte thermique est une puissante représentation visuelle des risques basée sur Power BI". explique Dominik Galsheimer, directeur général de LeapLytics GmbH. "En l'intégrant à Microsoft Project Operations, les entreprises peuvent mieux comprendre et gérer les risques associés à leurs projets. Nous sommes ravis que Ludwig Reinhard ait présenté notre carte thermique dans sa vidéo et nous espérons qu'elle aidera d'autres entreprises à gérer leurs risques plus efficacement."
Vous pouvez regarder la vidéo de Ludwig Reinhard sur son site web ici. Pour plus d'informations sur la matrice des risques de LeapLytics, veuillez cliquer ici. visitez notre page produit ici.
Ne manquez pas l'occasion d'améliorer votre flux de travail des opérations de projet avec une visualisation des risques plus robuste. Grâce à la matrice des risques de LeapLytics et aux conseils d'experts de Ludwig Reinhard, vous pouvez faire passer votre gestion des risques à la vitesse supérieure.
Regardez la vidéo et constatez par vous-même à quel point il est facile de créer des cartes de risques dans Microsoft Project Operations à l'aide de Power BI !