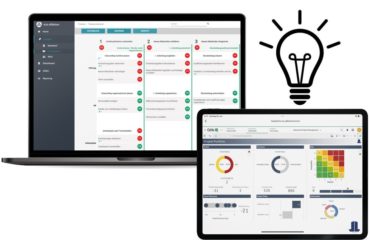
이제 공식 Qlik Sense Garden 지점에서 위험 히트맵을 사용할 수 있습니다! 히트 맵은 프로젝트 상태 보고의 중요한 부분이며 견고하고 유용한 프로젝트 관리 접근 방식의 중요한 부분입니다.

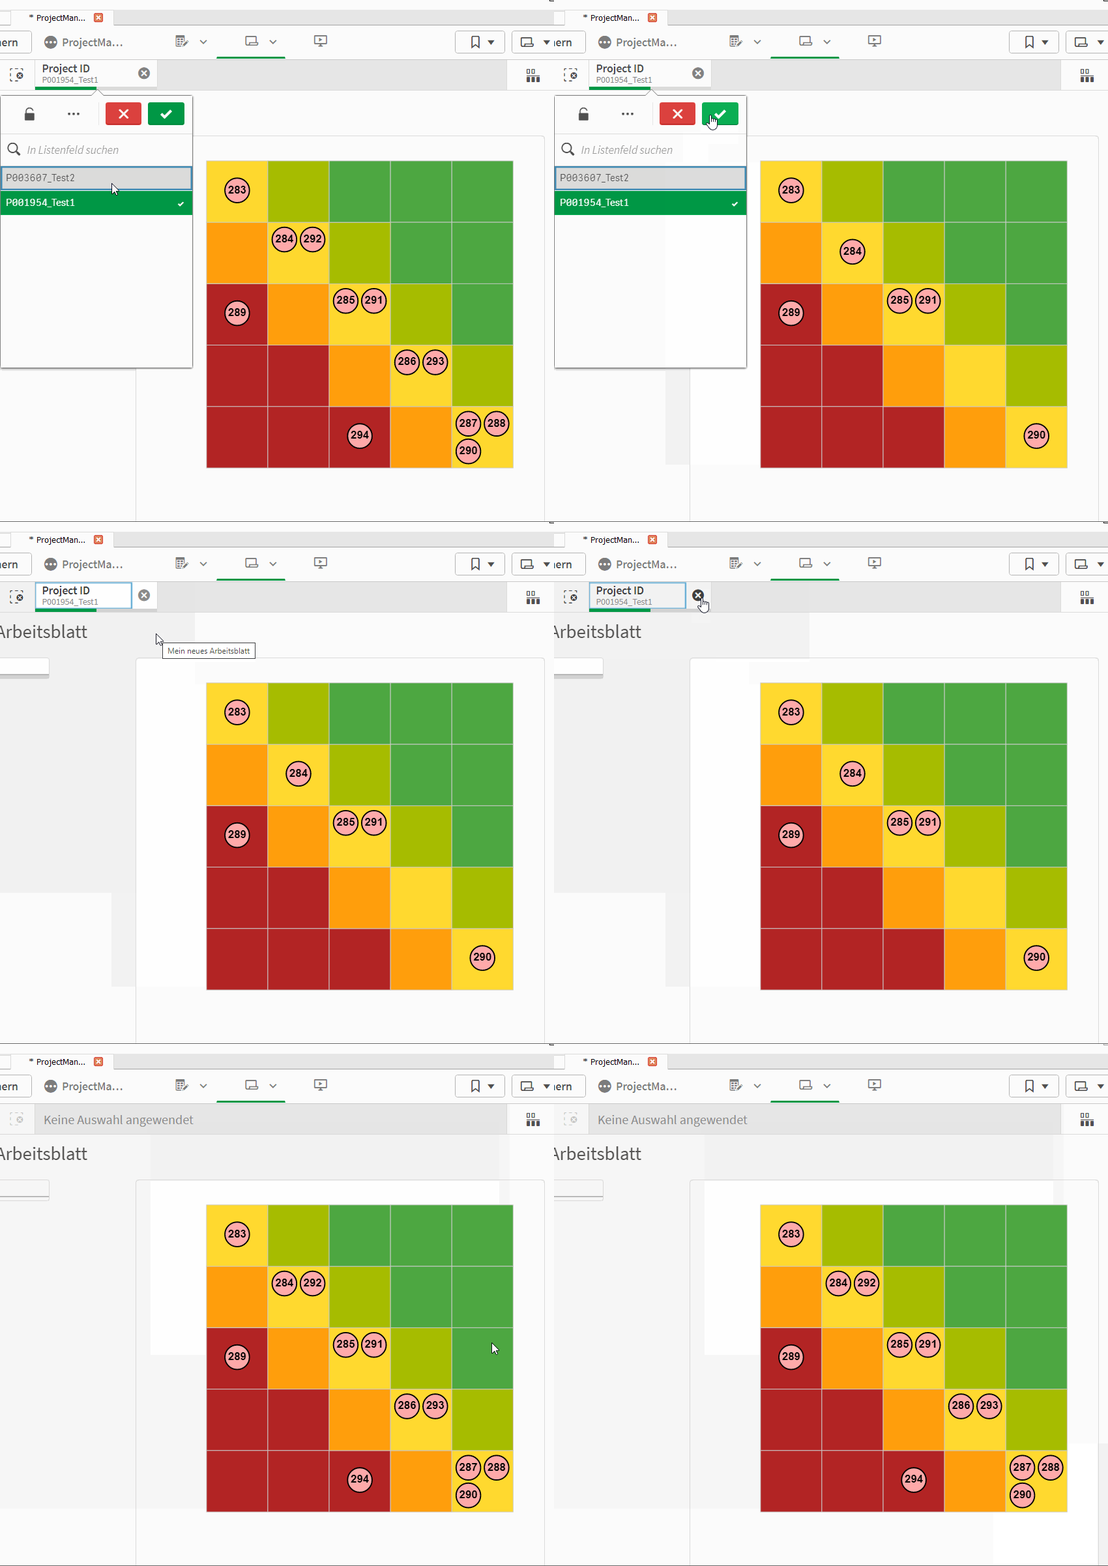
히트맵을 사용하면 위험 프로필을 시각적으로 명확하게 파악할 수 있습니다. 이 확장 프로그램은 두 개의 KPI와 서로 다른 카테고리의 매트릭스로 측정된 프로필을 시각화하기 위해 만들어졌습니다. 필드당 여러 개의 지표(무료 버전에서는 최대 4개)를 시각화할 수 있습니다. 3×3 및 5×5 필드 매트릭스, 테두리 및 텍스트 설정 간의 간편한 전환과 같은 다양한 설정을 통해 이 확장 프로그램을 보고 요구 사항에 맞게 조정할 수 있습니다.

자세한 내용은 문서 에서 확장 프로그램을 다운로드하고 Qlik 정원 Branch.
히트맵은 QlikSense용 프로젝트 관리 제품군의 두 번째 확장입니다. 마일스톤 보기 또는 프로젝트 성숙도 상태와 같은 더 유용한 확장 기능이 곧 추가될 예정입니다.
비욘 랑게 - LeapLytics
다음을 통해 새로운 정보 및 릴리스 업데이트를 구독할 수 있습니다. 구독 공식.
LeapLytics 소개
확장 프로그램을 통해 개별 솔루션을 통합합니다. 다양한 가능성을 활용하여 대시보드를 개선하고 아이디어를 구현하세요. 확장 프로그램은 다음과 같습니다. 명확한 구조 로 빌드되며 사용자에게 집중 를 사용하여 중요한 기능을 포기하지 않고 최대한 직관적으로 만들었습니다. 따라서 포괄적인 문서 가능한 사용 사례에 대한 자세한 설명과 함께 사용 및 구현을 가속화할 수 있습니다.


